There is this forumular to calculate the CO2 content of water by measuring pH and carbonate hardness. But I only found tables and calculators but no fancy graphs. Here is what to do:
#!/usr/bin/gnuplot
reset

set xlabel 'KH'
set ylabel 'pH'
set zlabel 'CO2 [mg/l]'

set view 56, 328
set isosample 20
set xrange [0:20]
set yrange [6.4:8.0]
set zrange [14.9:35.1]

set contour base
set cntrparam level incremental 10, 5, 40
set palette rgbformulae 33,13,10
set palette maxcolors 10

splot x/2.8 * 10**(7.90-y)

set isosample 1000
set view 0,0
unset surface
splot x/2.8 * 10**(7.90-y)
Which gives these fancy graphs:
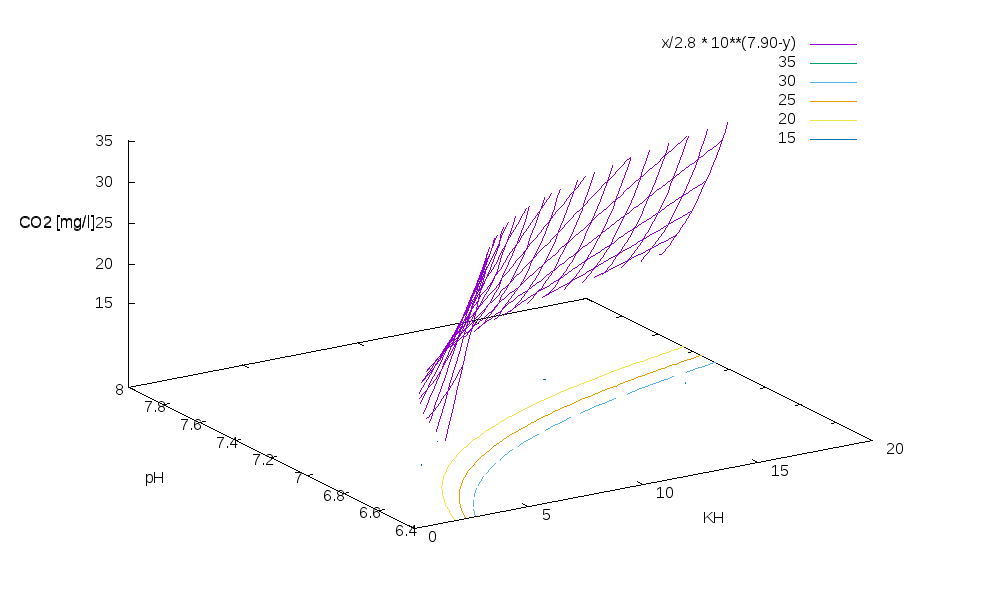
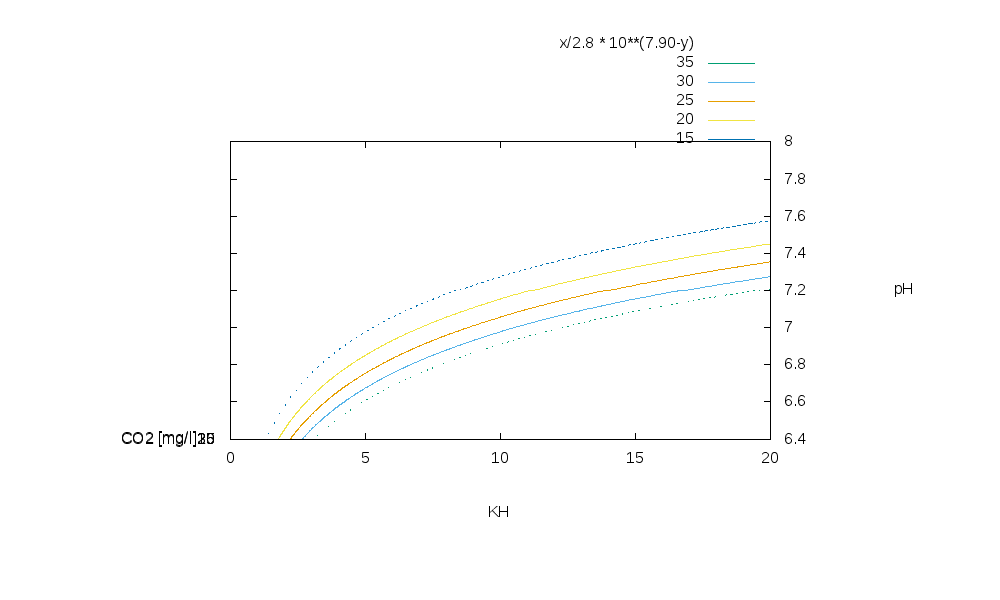
The optimal CO2 should be (at least what I read so far) between 20 and 25 mg/l. One page said 20 is the best value, everything above does not make any more difference for the plants but makes it worse for the fish.
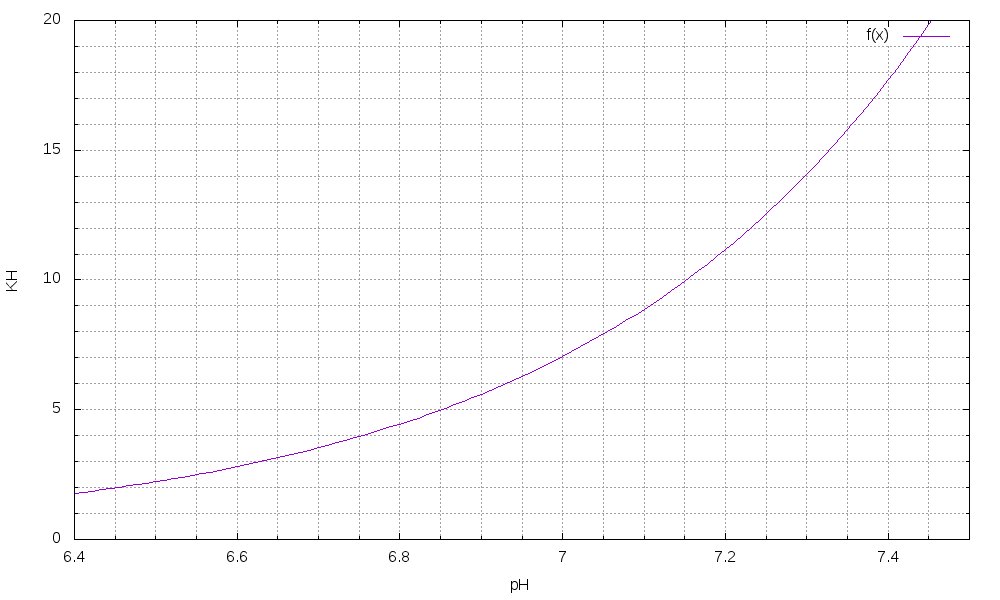
So lets plot the graph for 20mg/l only:
set mxtics 4
set mytics 5
set grid mxtics mytics xtics ytics
set xlabel 'pH'
set ylabel 'KH'
set xrange [6.4:7.5]
set yrange [0:20]
plot f(x) = 7.0*(2.0**(x-(49.0/10.0)))*(5.0**(x-(79.0/10.0))), f(x)
which gives us this graph here: